
12 Must-Track Customer Support Metrics (2024)
- Published: August 7, 2017
- Updated: December 1, 2023

Why do growing businesses need to track customer support metrics?
For the same reason they need to keep tabs on their product and behavioral analytics— these data points help you understand how your customers interact with your business’s offerings so you can experiment and optimize your offers better.
But when the rubber actually meets the road, you quickly realize that tracking and benchmarking customer support and growth metrics is much more complex than in theory.
In this article, we’ll explore the realm of customer support metrics, highlighting the various types available, pinpointing the most crucial ones to monitor, and offering guidance on leveraging these metrics to enhance your customer support efforts.
What Are Customer Support Metrics?
Customer support metrics are standardized measurements that are used to assess and track the performance, efficiency, and efficacy of a customer support or service team. By using these metrics, companies can gain insights into the quality of their customer service, identify areas that require improvement, and enhance the overall experience of their customers when they interact with the company.
Types of Customer Support Metrics
Customer support metrics can be grouped by the values they measure and how they convert into real-life results for your business. As a result, several support metrics fall into multiple brackets.
- Response metrics: Track the quantity and quality of customer support, and are aimed at finding recurring behavior patterns common to either your users, support agents, or certain periods (seasonal). They’re usually logged during and after a support interaction and include KPIs like First Response Time (FRT), time-to-resolution, and customer satisfaction score.
- Volume metrics: Measure the size of your ticket pipeline to help you gauge the volume of inbound requests, determine whether you need to enlist a larger support team, or even refine your product to remove recurring pain points. Volume metrics may be direct (e.g., Percentage of tickets escalated and solved and ticket request volume) or indirect (e.g., average handle time, FRT, or CSAT score).
- Satisfaction metrics: Measure the quality of support customers receive, typically after a support interaction. Similar to volume metrics, they can also be direct (e.g., CSAT, NPS, customer effort score, and resolution rate) or indirect (e.g., FRT).
- Resolution metrics: Answer the questions, “How many of our inbound support requests did we resolve satisfactorily?” and “How much effort did it take?” These include KPIs such as resolution rate, time-to-resolution, escalation rate, and first-call resolution rate.
- Efficiency metrics: Measure how quickly support interactions end in a resolution—in other words, they track how quickly your agents are working, deflecting requests (by directing customers to DIY resources such as help docs), and clearing your backlog of inbound tickets. These include your average handle time (for your entire team or filtered by agent), resolution rate, first response time, ticket resolution time, and escalation rate.
- Engagement metrics: Beyond the volume of tickets processed, engagement metrics and behavioral analytics track how much time was spent attending to each customer, their relative satisfaction with each interaction, and how many different touches it took to resolve their issue. Support engagement metrics include average handle time, customer effort score, CSAT score, Net Promoter Score, and time to resolution.
- Operational metrics: Track performance and measure how your customer support function contributes to your larger organizational goals, such as growing revenues, profits, and user count. These include your churn rate, NPS, and customer effort score.
12 Essential Customer Support Metrics to Monitor
Instead of relying on case-by-case analyses of your company’s customer support performance, the right help desk metrics and KPIs can help you draw a realistic picture of your support team’s performance and understand where your customer support needs work.
1. First response time (FRT)
FRT is the period of time it takes an agent to first respond to a customer’s ticket. While calculating first individual FRTs might not offer you any actionable data, you can use it to determine your average FRT and figure out whether you need to prioritize that first touch, reduce lag, and get to customers faster.
2. Customer ticket request volume
Your customer ticket support volume sums up the total number of open support tickets at a given time. It helps you keep eyes on your backlog, determine if you need more hands on your support team, and can reflect your support team’s productivity or lack thereof.
3. Customer satisfaction score (CSAT)
CSAT surveys ask, “How would you rate your overall satisfaction with the service you received?” and let respondents reply on a scale of 1 to 5, namely:
1— Very unsatisfied
2 — Unsatisfied
3 — Neutral
4 — Satisfied
5 — Very satisfied
You can calculate your CSAT score as the number of satisfied customers (i.e., No. 4 & 5 replies) divided by the total number of replies. CSAT surveys are usually a follow-up to a high-stakes decision or interaction, such as after upgrading to a paid tier, discussing with a support agent, making a purchase, or completing any specific action.
4. Net promoter score (NPS)
NPS measures how likely your customers are to recommend your business (to their family & friends) on a scale of 0 (not likely at all) to 10 (extremely likely) and helps you group your customer base into three brackets, namely:
- Promoters (9 – 10) who will actively promote your brand because it solved a significant problem for them
- Passives (7 – 8) who either don’t care as much or have alternatives
- Detractors (0 – 6) who are unhappy and would actively discourage potential customers from using your business
5. Ticket resolution time
Ticket resolution time is the length of time it takes a support agent to resolve a help ticket after it’s created by a customer.
While they’re very similar, AHT measures the length of a customer conversation and the time required for admin tasks before the ticket is closed—it doesn’t account for how long the customer might spend in a queue before an agent gets to them.
6. Resolution rate
Your ticket resolution rate answers the question, “How many of the tickets we receive get resolved?” It can be calculated by agent, channel, or duration (i.e., weekly, monthly, or quarterly) and keeps your agents proactive, helps you understand why customer sentiment might be negative, and allows you to create a game plan for more effective support.
7. Average handle time (AHT)
Average handle time (AHT) refers to how long (on average) your support agents spend on a call, starting when a conversation kicks off, plus the amount of time the agent spends resolving the issue the customer raised after the call (if hands-on support is necessary).
AHT can be calculated for your entire support workforce, specific agents, channels (email, phone, Twitter, WhatsApp, etc.), or specific periods of time (e.g., BFCM, May Day, etc.).
Tracking (and optimizing) average handle time helps you keep your support team proactive and reduces the time customers have to wait before their issues are fixed.
8. Customer effort score (CES)
Customer effort score calculates how much work your customers have to do to complete specific actions, such as upgrading to a paid tier, requesting a refund, updating their account information, or changing their password. Effort score surveys ask customers open-ended questions using the format of, “How easy did [organization] make it to solve [issue]?” and ask them to grade on a scale of 1 to 5 or 1 to 7.

9. Escalation rate
Escalation rate refers to the percentage of tickets that have to be escalated to a higher support tier, such as a team lead, a specialist, or a product manager.
10. Customer lifetime value (CLV)
Customer lifetime value (CLV) calculates how much revenue you expect to generate from a specific (or single) customer during the duration of their subscription to your product/service. It factors in the value of the customer’s first purchase, multiplied by their expected lifespan (i.e., how long you expect them to stick with your business).
11. Customer churn rate
Customer churn rate refers to the number of customers who stop paying for or using your product, usually over a specific period of time. Although churn cannot be directly attributed to your customer support performance, it can be a huge indicator that your support experience is subpar and that your customers struggle to find helpful DIY resources to figure out your product.
12. Customer retention rate
Customer retention rate is the inverse of churn and refers to the number of paying customers your business has retained over a specific period. Again, while support and retention are not directly proportional, high retention rates usually signal that your customers enjoy your product, or at least get their issues fixed without jumping through complicated hoops.

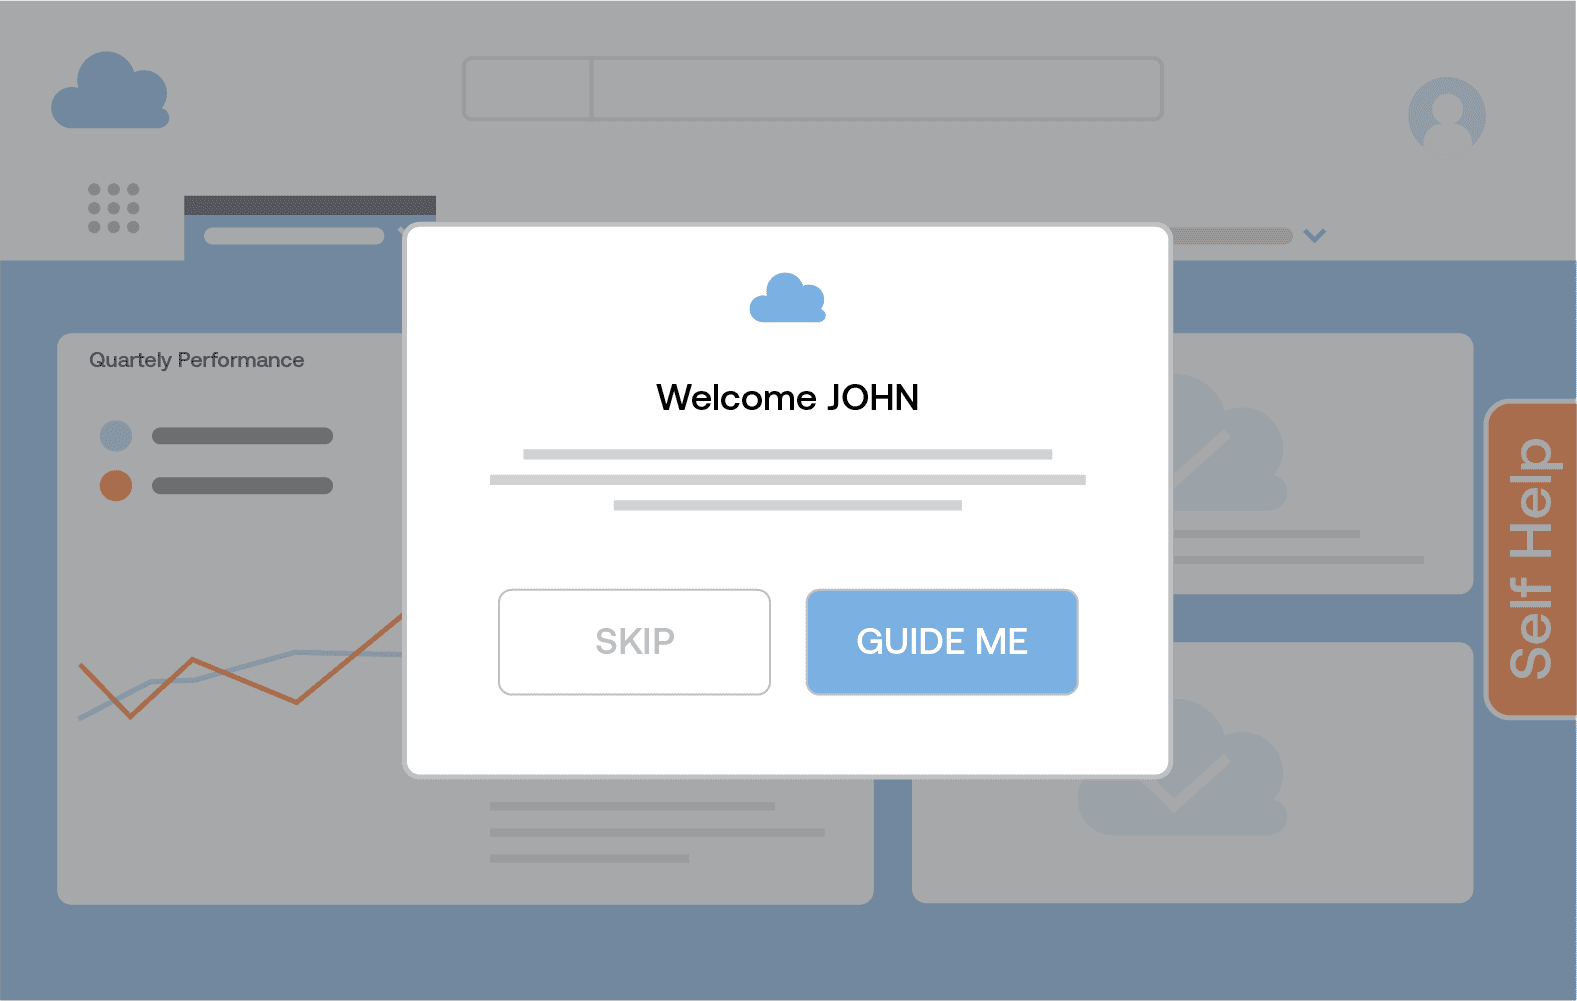
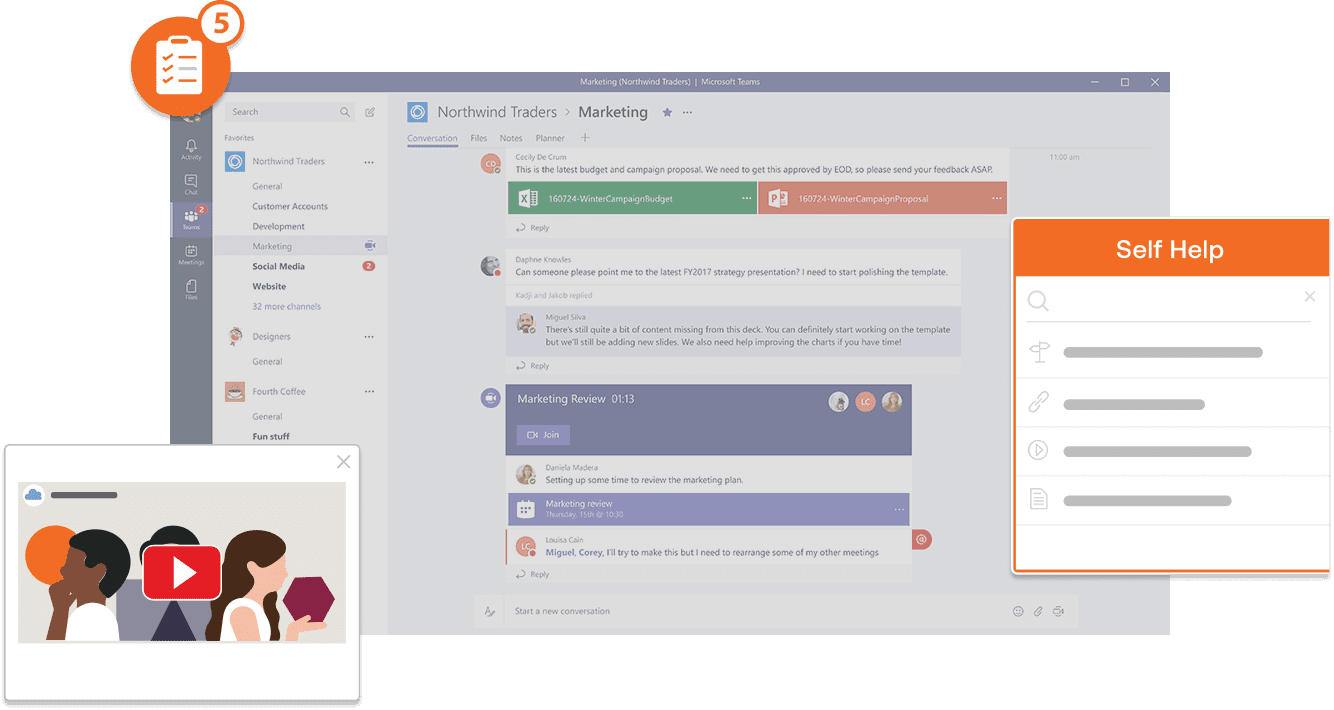
Above: Example of contextual help and user support built with a Digital Adoption Platform.
Whatfix’s Self-Help overlays on to any web application, desktop application, mobile app, or website. It provides contextual help to users and integrates with your FAQs, support center, LMS, user documentation, and more. Users are presented with common issues and help content for their contextual area in the application, or they can use an open-ended search to find the specific help content they’re looking for. These help support cards often prompt in-app guidance, walking users through the specific workflow they need help on.
8 Best Practices for Tracking Customer Support Metrics
On their own, customer support KPIs and metrics serve as a pulse for tracking your customer support performance so you can better understand where you might need to make changes, if any. Here are some best practices that can help you convert your metrics into actionable customer support improvements.
1. Set clear objectives
Before you start tracking your churn rate, CES, handle times, or first response benchmarks for your entire support team or specific agents, you need to specify a goal, whether it is to:
- Reduce churn and increase retention by X%
- Optimize customer lifetime value with freemium offers, discounts, and combos
- Determine whether you need to redesign your product’s architecture or train your agents better (e.g., if a significant percentage of tickets need to be escalated)
- Simplify your product’s onboarding process
- Understand your customer sentiment and why they think so
- Reduce wait times
Ultimately, your objective determines which specific metric you track. For instance, a SaaS company that’s trying to understand what new users think about their support experience can achieve that with an NPS survey, while a company that wants to reduce ticket escalation cases might view a high ticket escalation rate to mean that your support agents need more training to be able to resolve issues faster.
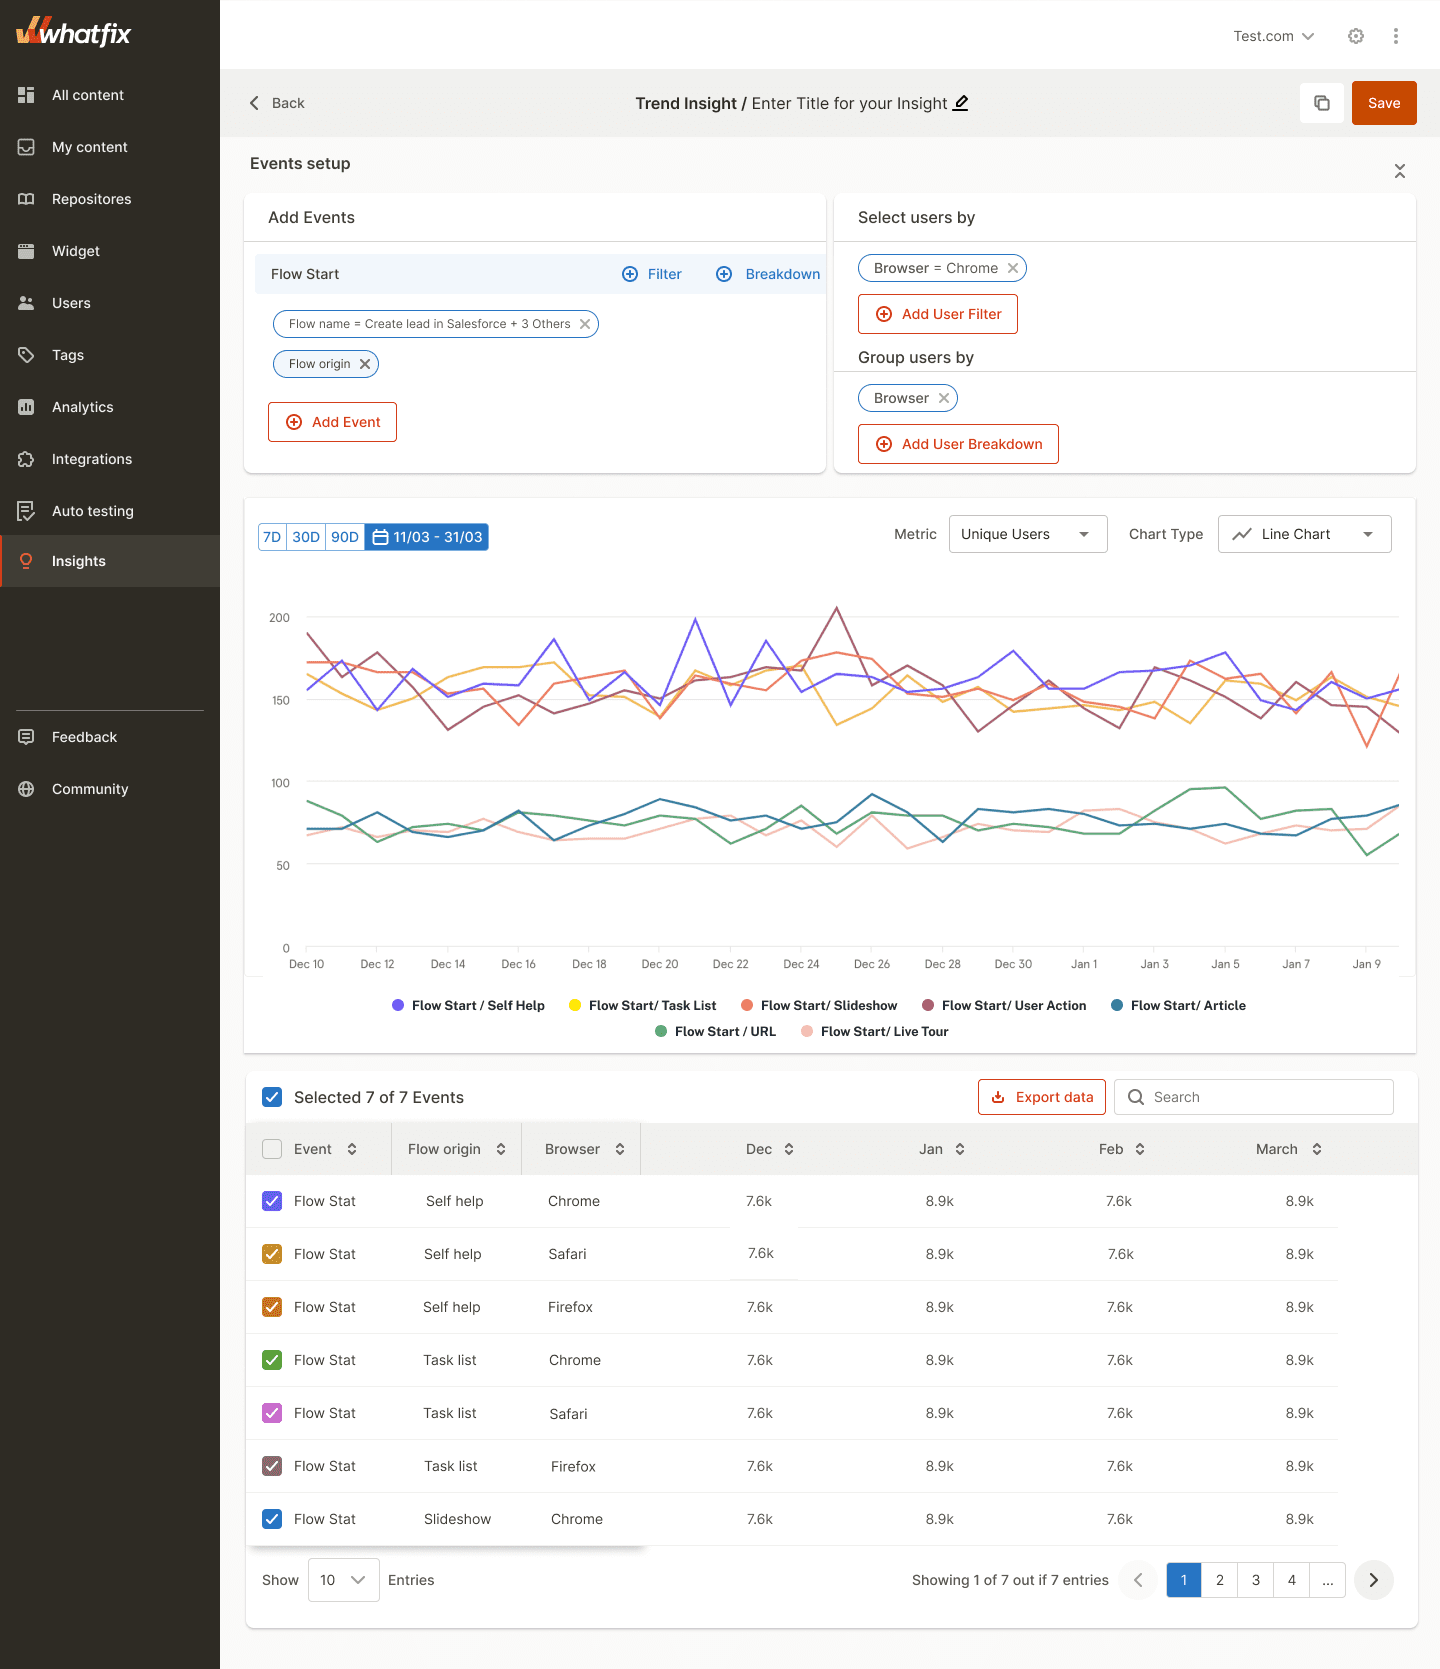
2. Use a centralized dashboard for real-time monitoring
A centralized dashboard gives you a 360-degree overview of all your metrics, making it easy to keep tabs on them and detect anomalies, trends, and patterns. You can also loop your data into third-party SaaS solutions like Geckoboard, Klipfolio, and Grafana for easier filtering and modeling.
3. Segregate metrics based on support channels
For the most part, compounded metrics can give you a quick overview of the state of your customer support experience. But if you want finer data points that can help you identify patterns and issues better, you’ll need to filter your call center metrics by channel, date, individual, length, resolution status, etc. Suppose you outsource call center services or use a BPO call center. In that case, this helps you isolate problematic conversations, understand what caused the issue, and create a roadmap for resolving such problems in the future.
4. Benchmark against industry standards
Brands like Intercom, Hiver, Klaus, Freshworks, Storyblok, and LiveChat publish annual customer experience performance benchmarks sourced from customer data. They can help you understand how you compare to your peers, anticipate common pitfalls you might expect to face as your company scales up, and the relationship between your customer support function and the rest of your organization’s operations.
5. Prioritize metrics based on business goals
Customer support metrics are a reliable measure of a business’s performance. At a glance, they can tell you if you’re bleeding cash, losing new customers to churn, and keeping customers waiting when they reach out for support. Inversely, you can invert that data and use it to prioritize metrics based on your business goals.
For example, if your goal is to:
- Grow revenues and profitability: Focus on reducing churn and improving retention.
- Improve customer satisfaction: Keep tabs on your CSAT, Net Promoter Score, Customer Effort score, etc.
- Reduce wait times: Monitor metrics like first response time, ticket resolution duration, and resolution rates.
6. Establish a consistent review schedule
Just like every other business metric, there’s a tendency for your customer experience metrics to become part of a performance theater routine— they get brought up during board meetings, quarterly reviews, and retrospectives, but hardly ever contribute to change.
One way to become proactive about your customer experience metrics is to make them more visible:
- Put them on digital signage screens across your workplace, especially if you have a large support team.
- Assign specific team members to manage each metric, improve, and report on them.
- Use the What?, Why?, and How? methodology to interpret changes to each metric and understand how to improve them further in each cycle (i.e., monthly, quarterly, etc.).
7. Ensure data accuracy and consistency
Verify that your data sources are reliable right from the start. Account for false positives, and remove any data sources that are repeatedly proven to be unreliable.
8. Train your support team on metric interpretation
Making your customer support metrics visible to your support team is just step one of making them stakeholders in improving these KPIs. To get any real, lasting change, you need to explain to them how each metric affects your organization’s health, revenues, profitability, bonuses, etc.
- Churn: A higher churn rate means you’re losing customers faster than you can add new ones; it needs to be reduced as close to zero as possible for your company to survive.
- AHT: Aim to spend enough time listening and solving the customer’s issues, but not at the detriment of other customers in the queue.
- CSAT: Your CSAT score (filtered by agent) shows how satisfied customers are with you on average. What can you do to improve it?
- CES: The more hoops our customers have to jump through to get issues resolved, the less likely they’ll stick around using your product. How do you resolve every issue in one touch?
- NPS: Each NPS shows how likely customers are to recommend your business to friends and family based on their interaction with you. How can you improve the experience during future conversations?
Ultimately, your customer support agents are your direct contact with your customers, and any attempt to improve your customer support metrics without involving your agents and educating them on why they even need to care will ultimately fail.
How to Use Customer Support Metrics to Improve Customer Support
While your customer support metrics might show you where you need to make changes in your customer support strategy, how do you convert them into action?
1. Identify and address recurring issues
Tracking your customer support metrics will help you see recurring patterns in your support experience, such as:
- Late replies: Observe patterns from specific team members, support channels, or during peak periods such as BFCM, Labor Day, Halloween, New Year’s Eve, and more.
- Churn: Notice if customers acquired via certain channels or through aggressive sales techniques demonstrate lower retention.
- Technical issues, bugs, and errors: Consult your engineering and product management teams for long-term solutions for persistent bugs and errors.
- High CES: Identify if numerous customers report needing to use multiple platforms (like Twitter, Facebook, WhatsApp, email, or live chat) before receiving a response.
Filtering through your customer support metrics will help you understand how much of your customer support challenges are caused by one-off incidents and those resulting from seasonal issues or repetitive lapses from your engineering team, support agents, or sales so that you can solve problems at the root.
2. Optimize response and resolution times
A survey of 3,200 consumers by SuperOffice & Jeff Toister shows that customers expect to get replies to their emails (and other support communications, by extension) within four hours. In reality, the average organization replies to queries after 12 hours; at the far end of the range, customers often have to wait as long as eight days for a reply, while an astonishing 62% don’t reply at all.
Some tactics that can help you reduce your customers’ wait times so they can get issues resolved faster include:
- Using email autoresponders to acknowledge receipt and make sure customers aren’t left unattended
- Resolving known issues with if-then chatbot sequences
- Investing in a distributed, global workforce so you’ll always have someone available to answer customer queries
- Gamifying response times by ranking agents based on average response time and giving away cash bonuses to the best performers
3. Allocate resources based on ticket volume
You can use an automated help desk system to assign agents new requests based on their ticket queue, speed, average resolution rate, and the customer’s value. Likewise, you can assign high-ticket customers to your best agents exclusively, prioritize their requests when you have a larger ticket volume, and grant them access to exclusive support channels.
4. Tailor training based on agent performance metrics
A support agent might have a high first response benchmark but a below-average CSAT score. Another might have a nearly perfect resolution rate, but spends too long on individual calls, giving low-ticket customers white-glove service.
While commendable, it leaves little time for other customers, and clogs your support backlog.
In both cases, you need to tailor the coaching experience for each agent, focusing on their weak points (customer satisfaction and brevity, respectively) and encouraging them to make the necessary changes without modifying the parts of their customer support approach that work well.
5. Refine knowledge base content using engagement metrics
Product analytics can help you understand how users browse your support docs, including which pages they visit, interact with the most, spend the most time viewing, and which pages they view last before existing (signaling a possible resolution).
Looking at those engagement metrics for your self-help content will help you expand (or trim) them accordingly, include learning aids and resources (pre-recorded demos, GIFs, and videos), and make them more relevant for other viewers.
6. Adjust support hours based on peak ticket times
When you start tracking your customer support metrics consistently, you may notice that the bulk of your support tickets tend to be created during a narrow time bracket— especially if most of your customers are located in a single region.
Looking at that data, it’s easy to draw bounds for when to expect the majority (let’s say, 65% to 90%) of your future tickets to be logged. As a result, you can reset your support hours to that time bracket and reduce customer frustration when you don’t respond outside those hours.
7. Use CSAT and NPS scores to gauge and enhance satisfaction
More than just judging the quality of support interactions, experience metrics like your customer satisfaction score and Net Promoter Score can be repurposed to help you understand your customer sentiment around your product, pricing structure, free trial length, money-back guarantee, and tiered limits.
Depending on the platform you use, many NPS & CSAT tracking tools enable you to insert a free text field where customers can specify the reason for their score and what they think you can do better.
8. Reduce ticket escalation by improving first-contact resolution
A high escalation rate usually means that:
- Your agents don’t have sufficient experience to resolve issues independently.
- Your product has underlying technological issues that have to be routed to the engineering team repeatedly.
- You need a library of DIY self-help content that customers can refer to before contacting support.
In any of these cases, that metric can help you solve the underlying problem, reduce resolution times, and fix issues quickly without tying down multiple agents.
9. Implement feedback loops with product and development teams
Customer support is a tripod that includes:
- Product management: Think ideation, customer interviews, etc.
- Engineering: Turning mockups into code, fixing bugs and errors, etc.
- Customer support: Engaging customers through their product experience to understand what works and what doesn’t, teach them how to navigate the product better, and report back to product management and engineering to fix any technical or usability issues.
Without any part of that matrix, you can’t have a sustainable product— bugs and errors will go unfixed and customers won’t have detailed guidance to use features, while product managers and engineers will be in the dark about what your users actually think about the product.
To avoid this, you need the three functions (product, engineering, and support) to work in unison, prioritize the same metrics, and regularly check in with each other to ensure they’re on the same page.
How Whatfix Helps Enterprises Optimize Customer Support Metrics
Learning how customer support metrics matter to your business is just half the work done. Better still, you need to start tracking them, understand how they influence your product, engineering, and support strategy, and use them to refine your product regularly.
Whatfix is a digital adoption platform (DAP) that uses product analytics to help enterprises:
- Track engagement for on-demand support resources, including product docs and self-help articles
- Capture (and interpret) user actions, including clicks, page visits, and mouse hovers— all without writing code
- Refine your product’s user experience with detailed analytics and behavioral insights
- Understand how customers navigate through your product and towards support with journey analyses
Learn how Whatfix can transform your customer engagement with product analytics built for scale.
Dive deeper with more customer support content.
Are you looking to become a more data-driven product manager? Explore our product analytic-centric content now.
- What Is After-Sales Service? +Benefits, Examples, Metrics
- 18 Best Customer Self-Service Software (2024)
- Real-Time Support: The Key to Happy Customers (2024)
- What Is Product Support? +Benefits, Best Practices, Tools
- The Ultimate Call Center Training Guide (2024)
- How to Create an Effective End-User Support Strategy (2024)

What Is Whatfix?
Whatfix is a digital adoption platform that provides organizations with a no-code editor to create in-app guidance on any application that looks 100% native. With Whatfix, create interactive walkthroughs, product tours, task lists, smart tips, field validation, self-help wikis, hotspots, and more. Understand how users are engaging with your applications with advanced product analytics.
Like this article? Share it with your network.
Subscribe to the Whatfix newsletter now!
Table of Contents

Software Clicks With Whatfix
Whatfix's digital adoption platform empowers your employees, customers, and end-users with in-app guidance, reinforcement learning, and contextual self-help support to find maximum value from software.


Thank you for subscribing!
Sign up for the Whatfix blog
Join 300,000+ monthly readers learning how to drive software adoption by signing up to receive the latest best practices and resources.